
Field notes · Revenue building
Hidden shipping cost is a bigger SEO problem than your title tags
A checkout that leaks converts every dollar of acquisition spend into a bounce. Ranking better on a leaking funnel just means more people leave. Here is how to price your leak before you spend another dollar on traffic.
By Yishai — thirty years in search
The most expensive fourteen dollars in ecommerce
A specialty retailer selling technical outdoor gear, high five figures a month, came to me with a familiar brief: they wanted to outrank two competitors on about forty category terms.
I spent the first day buying things from them. Three orders on three devices.
Their average order value was $187. Shipping was calculated at checkout, after the address form, on the third of four steps. It came out to $14.95 on a typical order. Free shipping existed at $250, which was mentioned in a rotating banner on the homepage and nowhere on any product page.
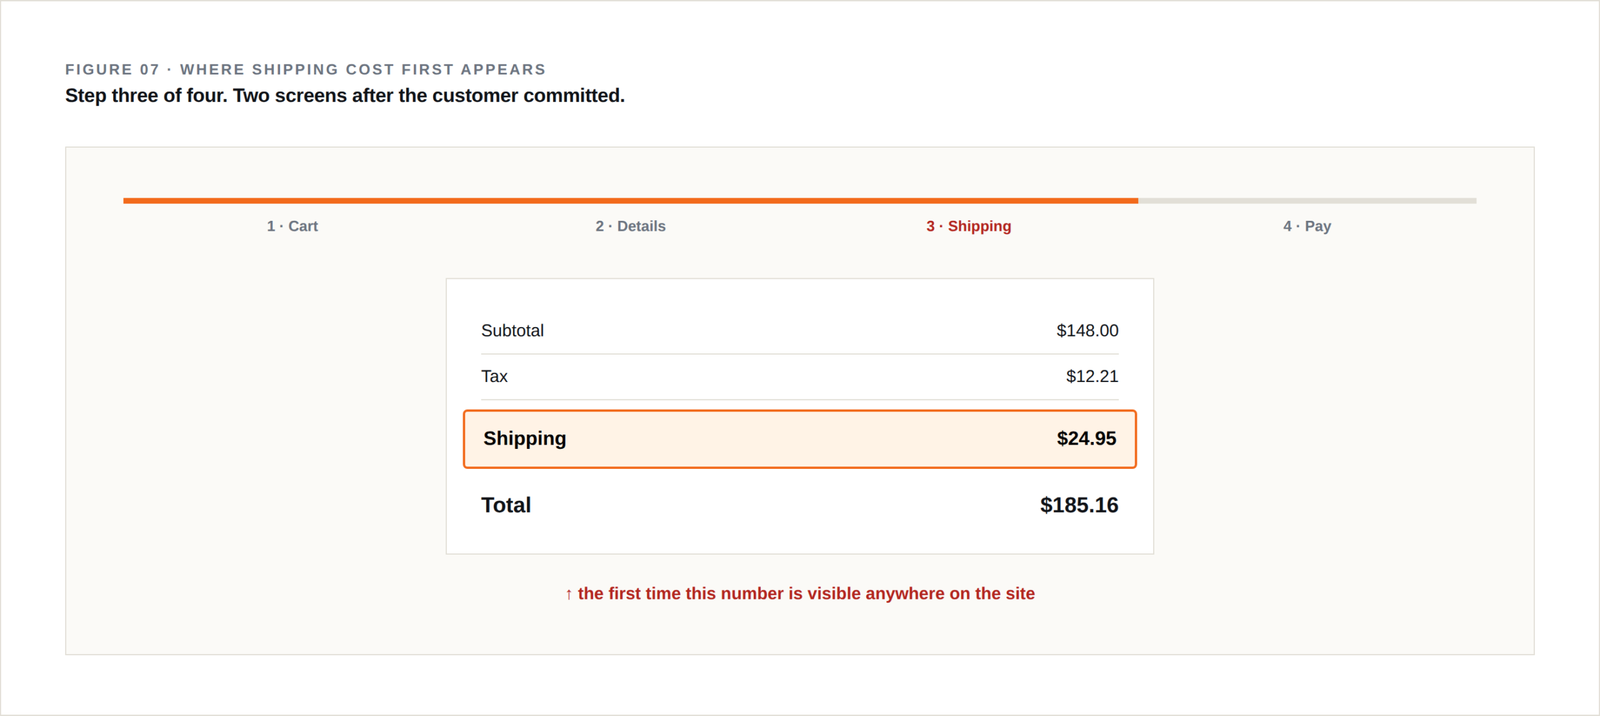
Checkout abandonment was 81 percent. Industry-typical is bad. Theirs was worse than typical, and 68 percent of the abandonment happened on the exact step where the shipping cost first appeared.
Here’s the part I want to sit with. They were not hiding it maliciously. Their platform calculated real-time rates by weight and zone, which is more accurate and, on heavy technical gear, often genuinely cheaper for the customer. The system was honest. The experience was a bait and switch, because the customer had spent nine minutes assembling a $187 basket under one price assumption and then had that assumption revised upward at the last possible moment.
Accuracy and trust are not the same thing. They optimized for accuracy.
Ranking better on a leaking funnel
Do the arithmetic before you do anything else.
They had 62,000 organic sessions a month. Product page to cart, 4.1 percent. Cart to checkout start, 44 percent. Checkout completion, 19 percent. That produced roughly 212 orders a month at $187, about $39,600.
The forty-term ranking project they wanted was realistically worth maybe 35 percent more qualified organic sessions over eight or nine months. Call it 21,700 sessions. Run them through the same funnel: about 74 more orders, $13,800 a month more revenue. It would have cost them a bit over $40,000 in fees and content over that period, so it pays back, eventually, if nothing else changes.
Now run the same 62,000 sessions through a checkout completion rate of 31 percent instead of 19. That’s $25,000 a month more revenue. From no additional traffic. And it makes the ranking project worth $22,500 a month instead of $13,800.
That’s the whole argument. Conversion improvements are multiplicative. Traffic improvements are additive. When your funnel leaks, every dollar you spend on acquisition is discounted by the leak, and you pay that discount forever on every visitor you ever earn.
Ranking better on a broken checkout means paying to introduce more people to your worst moment.
Ranking better on a broken checkout means paying to introduce more people to your worst moment.
Pricing the leak before you spend on traffic
You can do this in an afternoon with data you already have. I do it in the first three days of every ecommerce audit.
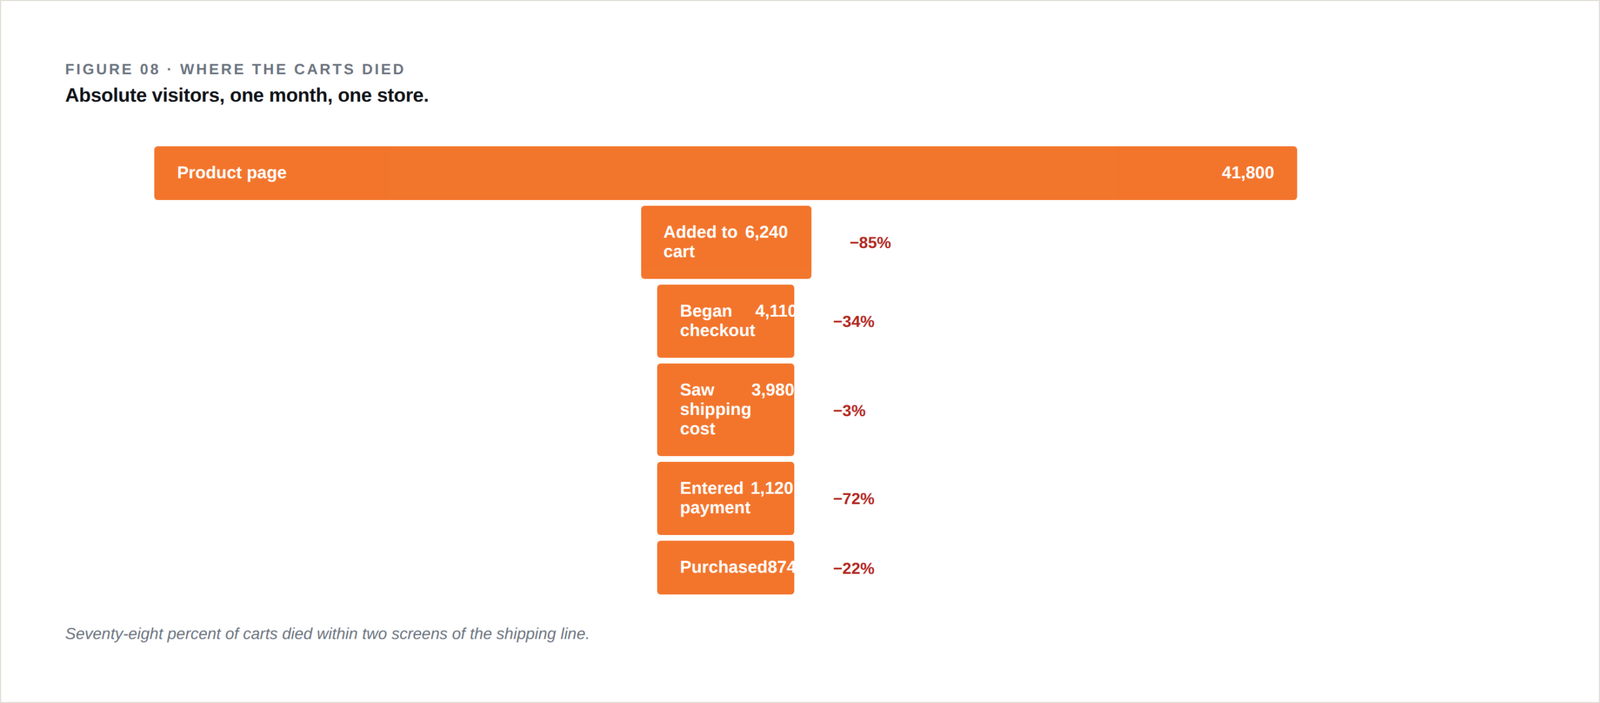
Step one. Get your funnel in absolute numbers, not rates. Sessions, product views, add to cart, checkout started, order placed. Rates hide magnitude. A 2 percent improvement on a step 40,000 people reach is worth more than a 20 percent improvement on a step 900 people reach, and rates make those look comparable.
Step two. Find the biggest single-step drop by absolute count of people lost. In this account it was checkout step three: 4,200 people a month reached it and 3,400 left.
Step three. Value the recovery conservatively. Assume you fix one third of that step’s drop, never more. 1,130 people, times the completion rate for people who get past that step, times AOV. Then halve it, because I have never once seen an estimate come in high and I would rather be wrong toward the client’s favor.
Step four. Compare that number to what the same money spent on traffic would produce over the same window. Not against zero — against the alternative use of the money. That’s the comparison that changes minds in a room.
For the retailer: the conservative recovery estimate was $18,000 a month. The ranking project’s estimate was $13,800 a month, arriving nine months later. That decided the sequence in about four minutes, and it was the client who said it out loud, not me. Numbers do that work better than argument does.
What we actually changed
Four things, over five weeks, none of them requiring a replatform.
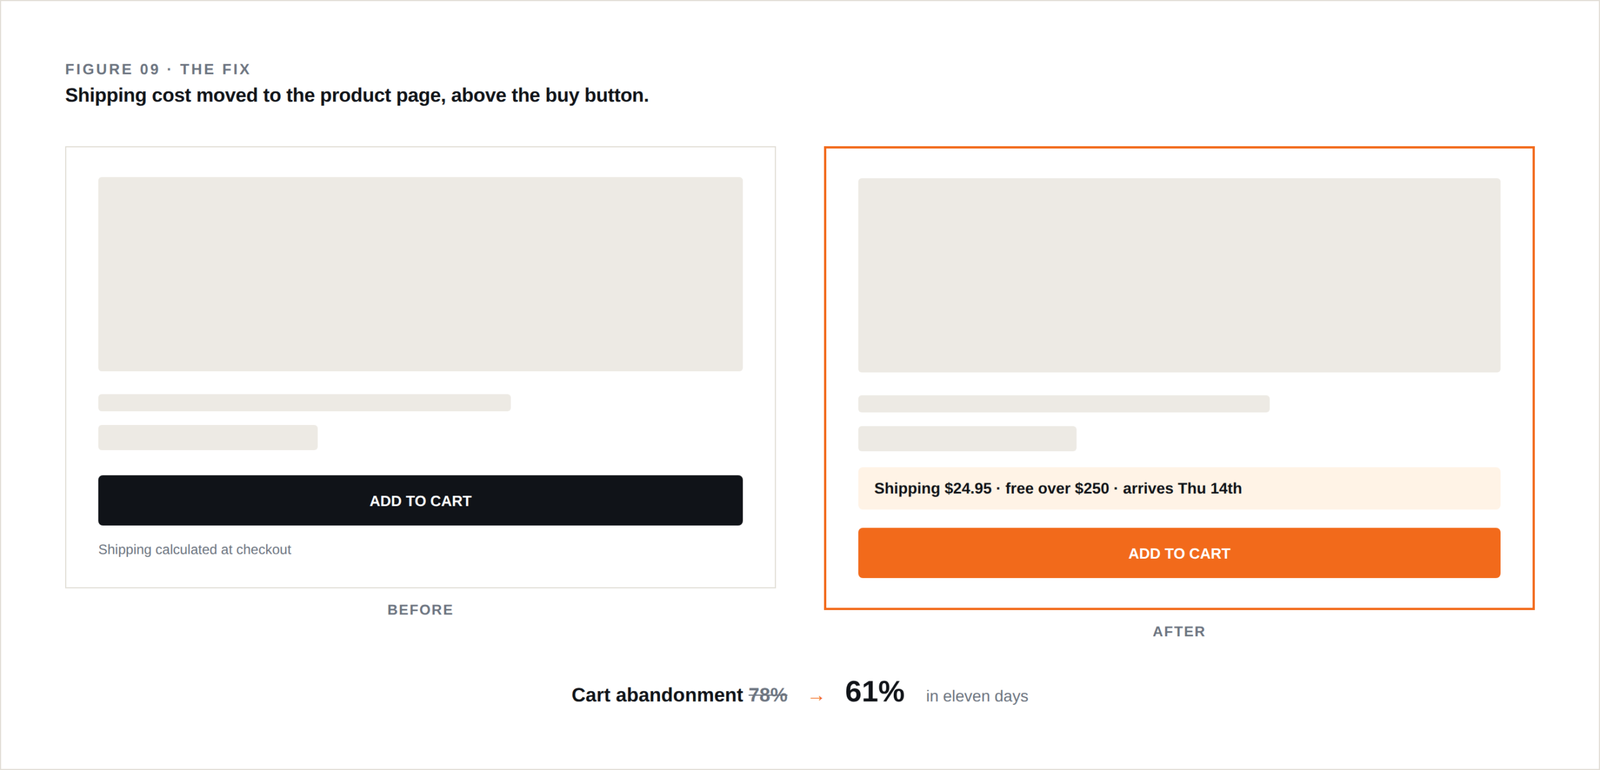
Shipping cost moved to the product page. A simple line under the price: “Ships free over $250. Otherwise $9.95 flat.” That meant abandoning real-time rate calculation in favor of a flat rate. Their finance lead ran the weight distribution and found a flat $9.95 cost them about $1.10 per order in margin on average.
The free shipping threshold got a progress indicator in the cart. “Add $63 for free shipping.” AOV rose 9 percent within a month, which more than covered the $1.10.
Total cost appeared before the address form, not after. This was a platform setting that had been left at its default for four years.
Guest checkout, which had been disabled because someone wanted the email addresses.
Ninety days later: checkout completion went from 19 percent to 34 percent. Orders per month, 212 to 379. Revenue from roughly $39,600 to $77,000 on flat traffic. AOV was up to $204.
We did the ranking work afterward. It performed better than my original estimate because every session was now worth 79 percent more.
Why this is your job
I know the objection. Checkout is the platform team’s problem, or the merchandising team’s, or the CFO’s. The title on the invoice says search.
Two answers.
The practical one: you are the only person in the organization who watches a visitor’s entire path from a query to a purchase. The merchandiser sees the product page. The platform team sees the transaction. Nobody else is standing at the top of the funnel holding a stopwatch. If you don’t say something about the leak, the observation dies with you.
The commercial one: your work is judged on revenue whether or not you agreed to that. When the quarter ends and organic sessions are up 40 percent and revenue is up 6 percent, nobody accepts a chart about title tags. The client isn’t wrong to feel cheated. They bought outcomes.
There is a third answer, less comfortable. Refusing to look at the checkout is a way of staying safe. Rankings are defensible — you can show a graph going up and nobody can prove you didn’t cause it. Revenue is not defensible in the same way. It’s the harder number to be accountable to, which is exactly why it’s the one worth taking.
Fix the leak first. Then go get the traffic. Doing it in that order is worth more than any two ranking positions you’ll ever win, and it takes weeks instead of quarters.
Want this pointed at your site?
The Revenue Audit tells you what’s actually wrong in two weeks. $3,500, and it’s yours whatever you decide to do next.