
How these are written
The rules every case study has to survive.
Most marketing case studies are advertisements wearing a lab coat: cherry-picked wins, percentages with no denominators, and a “300% increase” that turns out to mean three leads became nine. So before you read this shelf, you should know the rules it’s written under — because the rules are the reason the numbers can be trusted.
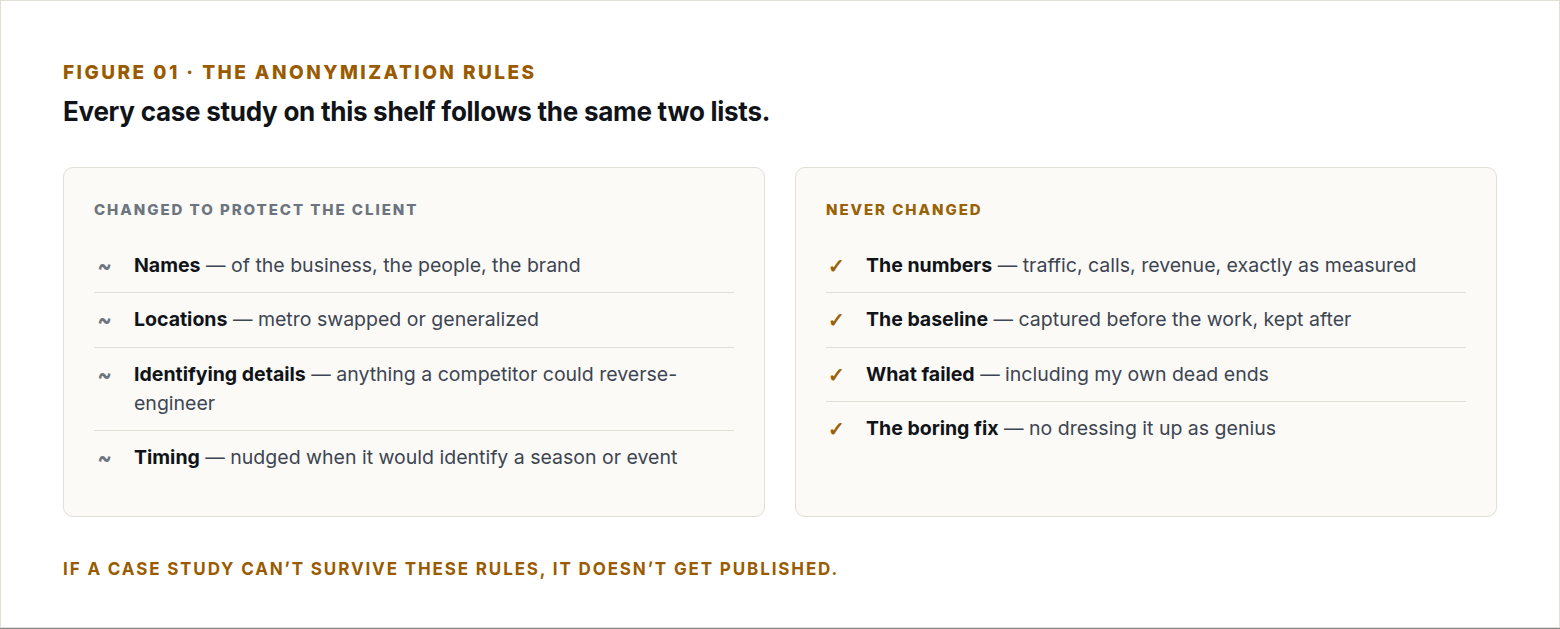
Two of those rules deserve a word. “What failed” stays in because every real engagement has dead ends, and a case study without one is a story, not a record. And “the baseline” stays in because every one of these studies starts the way every engagement starts — with the before captured on day one, so the after means something. If you read only one thing on this site about how I work, that habit is the thing.
The shelf
Three engagements, written up in full.
Each one runs the same arc: what the client believed was wrong, what the baseline actually showed, the fix — usually smaller than anyone wanted it to be — and what the numbers did afterward. None of them will pitch you. The work is the pitch.

They were optimizing for the 30% of conversions that didn’t matter.
An HVAC contractor whose call tracking saw less than a third of what the phone was actually doing — so every marketing decision for two years was made on a minority report. The fix wasn’t more traffic. It was counting.
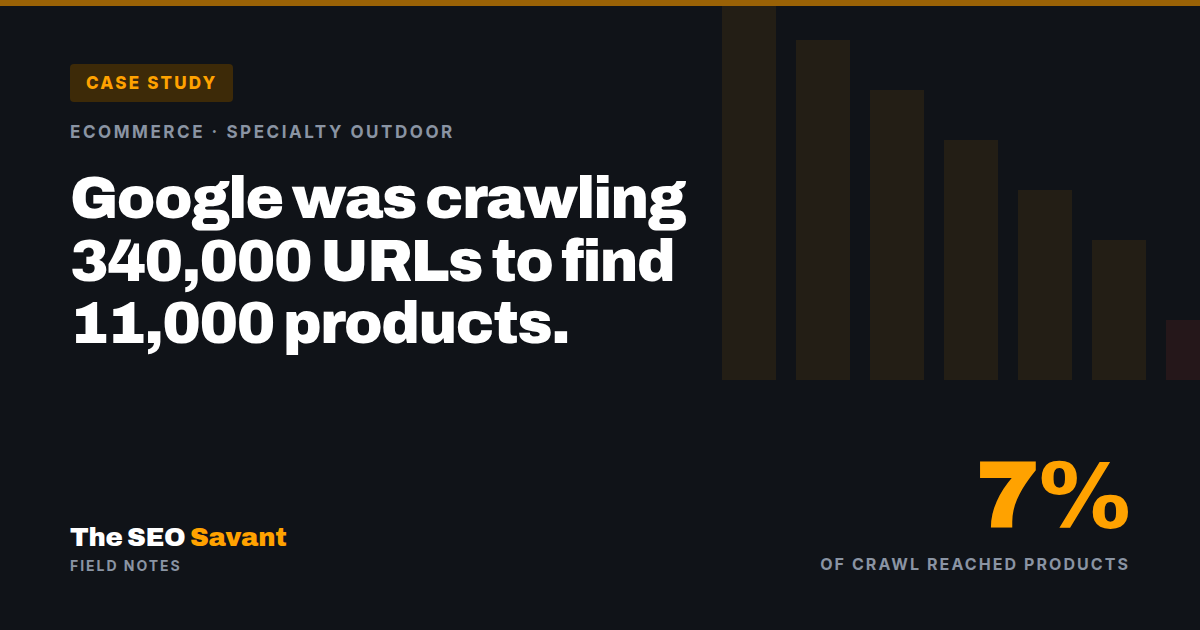
Google was crawling 340,000 URLs to find 11,000 products.
An ecommerce catalog drowned by its own filters — thirty junk URLs generated for every real product, and the products losing. No new content, no link building: the fix was teaching Google to stop reading garbage.
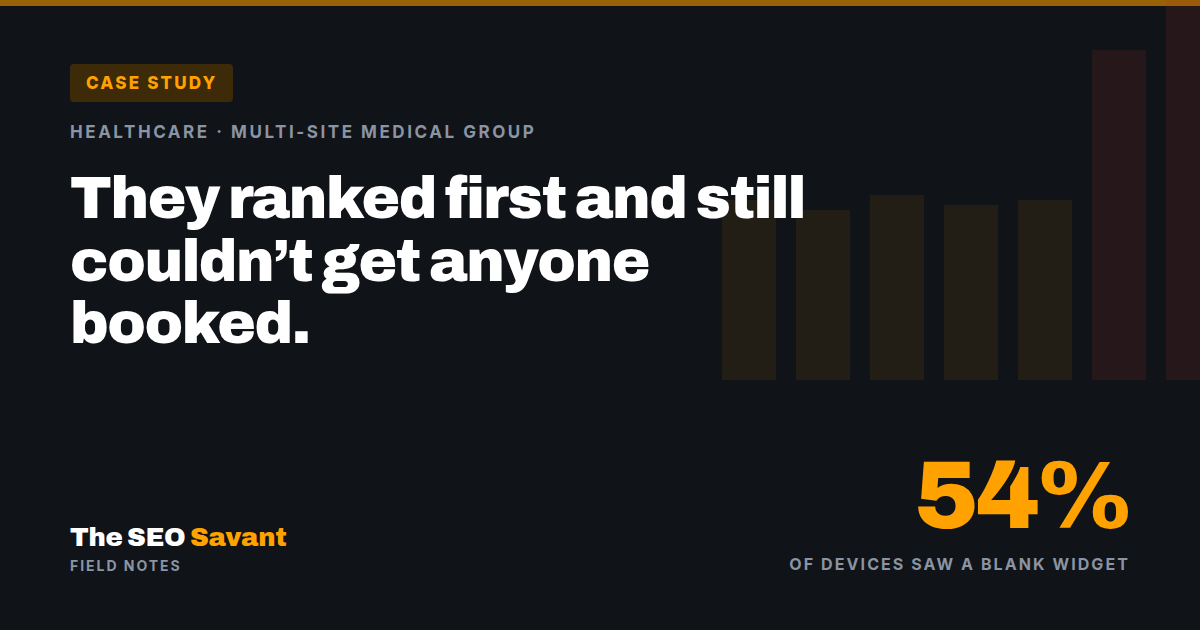
They ranked first and still couldn’t get anyone booked.
A medical practice with the #1 ranking, steady traffic, and collapsing bookings — because the booking widget quietly died on phones and nobody was watching the step where the money happens. Rankings never moved. Revenue did.
What they share
Three industries. One diagnosis walking in the door.
Read the three in a row and a pattern emerges that’s worth more than any single study: every client arrived convinced they had a traffic problem, and none of them did. The HVAC contractor had a measurement problem. The retailer had a crawl problem. The practice had a broken button. Traffic was the one thing all three already had.
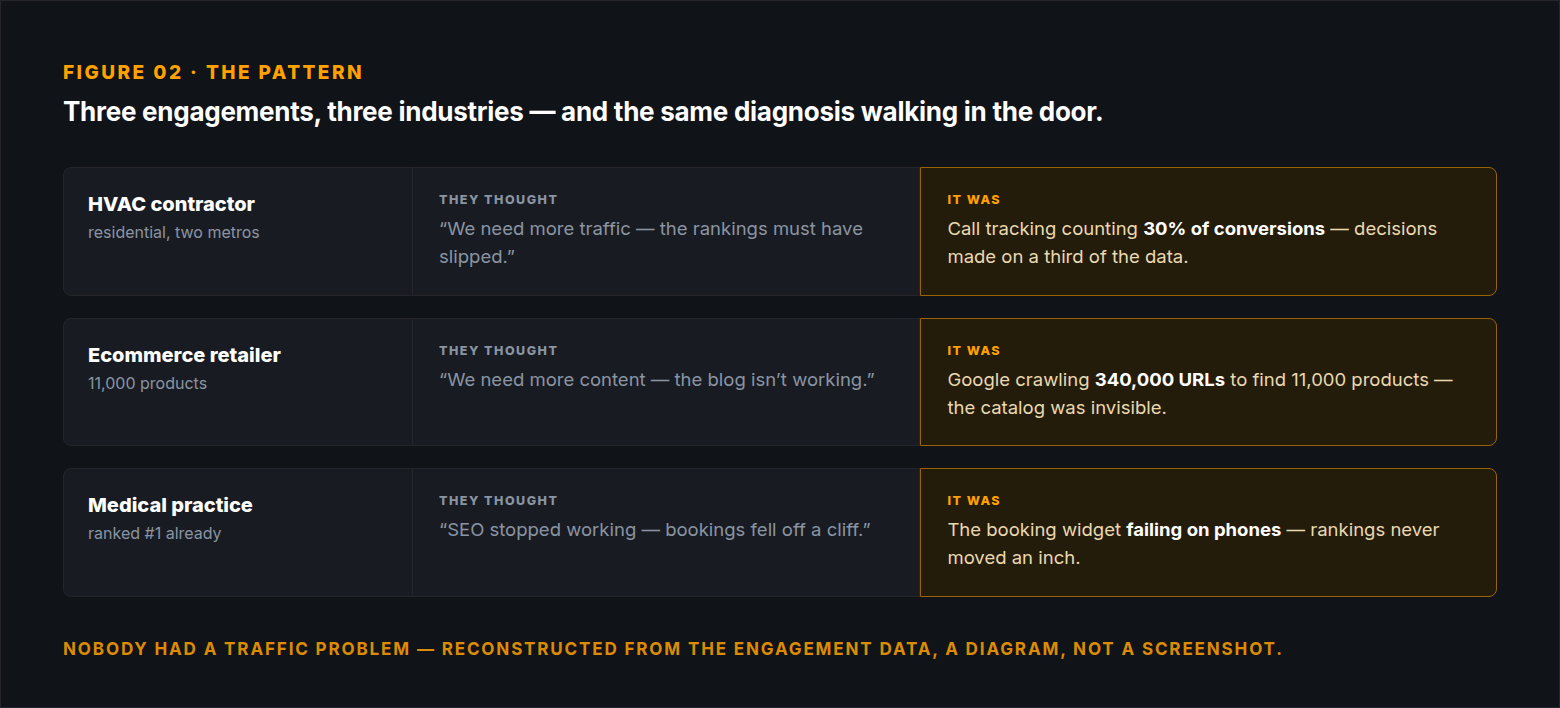
This is why I don’t sell traffic, and why the Revenue Audit looks at all four lenses instead of confirming the one you arrived worried about. If three businesses this different can share a diagnosis, the odds your real problem matches your suspected one are worse than you’d like — and finding out costs a great deal less than a year of fixing the wrong thing.